Debug Mode
Starting with version 2.5.2.10, in addition to its logging functionality, Wizlink ® Designer provides a fully-featured Debug mode, allowing for easy testing, monitoring and resolving issues in scenarios during their execution.
The Debug mode allows for observing variable and activity behavior, both on a step-by-step basis as well as stopping only at a certain point in the scenario’s execution to check variable state.
A scenario can be run in Debug mode using the yellow Debug button located in the main menu panel or by using the Ctrl+F5 keyboard shortcut.

Scenario will execute as usual up to the point when it encounters the first breakpoint.
Breakpoints
A breakpoint is a pause in execution of a given scenario at a predetermined point. It can be placed on most activities by clicking on the small square icon in top right corner.
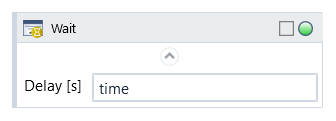
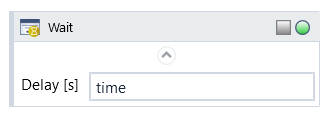
Due to their nature this option is not available for some 'system' activities, predominantly Assign Variable, as well as activities from Flowchart Tools and Flow Control activity groups, such as Sequence. To that end, under Utility group there is now a new activity, Breakpoint, which allows for greater flexibility in breakpoint placement.
When adding the Breakpoint activity to the flowchart, the breakpoint option is set automatically.

Note: A breakpoint on an activity will be ignored, if the activity is turned off.

Main Debug window
When encountering a breakpoint the execution of a scenario pauses before starting the activity and a Breakpoint window appears. It displays activity’s Display Name and its path in scenario, as well as input arguments about to be sent to it.
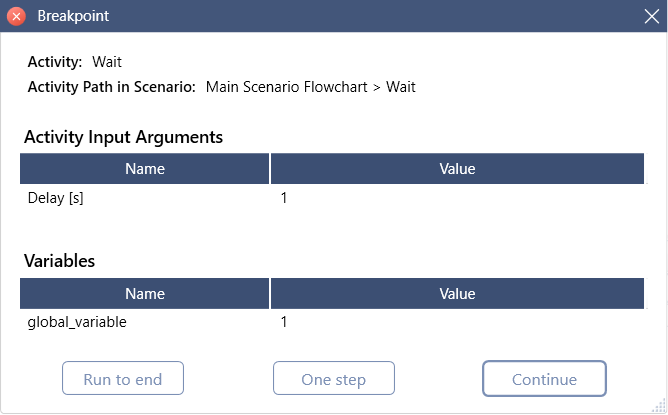
Listed are also all the variables visible in current scope as well as their values at that point in the scenario’s execution.
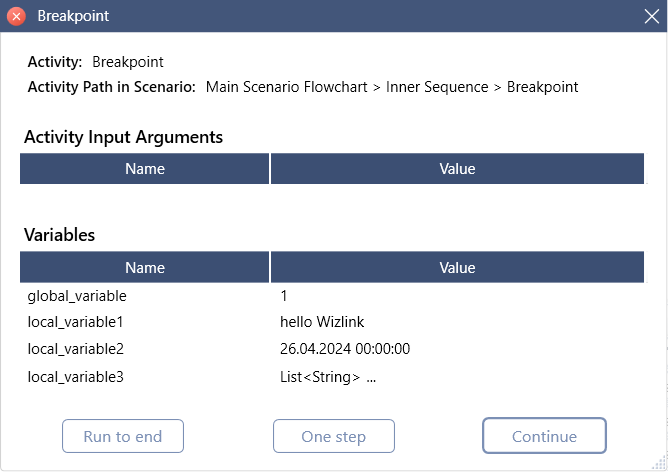
(Note: As Breakpoint activity does not accept input arguments, that part of the window is empty.)
The Breakpoint window is capable of previewing both simple and complex variable types (pictured: Int32, String, DateTime and List of String)
A more complex variable type can be viewed by clicking on the […] button, which brings up an additional window.
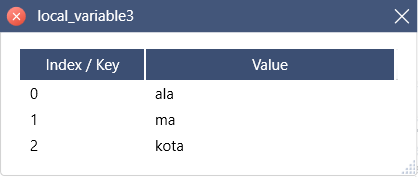
The Breakpoint window offers three options:
Run to end will execute the scenario to the end, ignoring any further set breakpoints.
One step will execute the activity and pause again at the next non-system activity, even if a breakpoint for that activity isn't set.
Continue will continue seamless execution of the scenario up until the next breakpoint when it will stop again, or to the end, if no further breakpoints are encountered.
Breakpoint management
Breakpoints in the scenario can be managed globally from the new Breakpoints menu option.
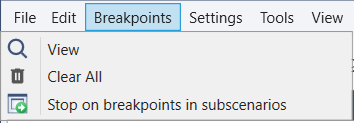
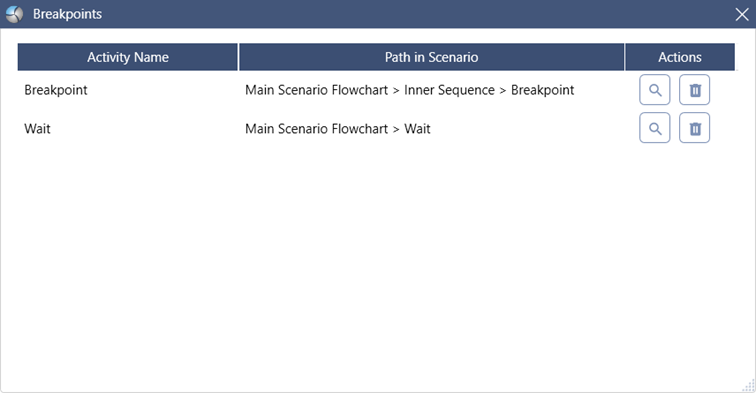
View brings up a window listing all the breakpoints currently set in the scenario, from where they can be navigated to in scenario flowchart (looking glass icon) or removed (trash icon).
Clear All will remove breakpoints from all the activities in the scenario, no matter the scope.
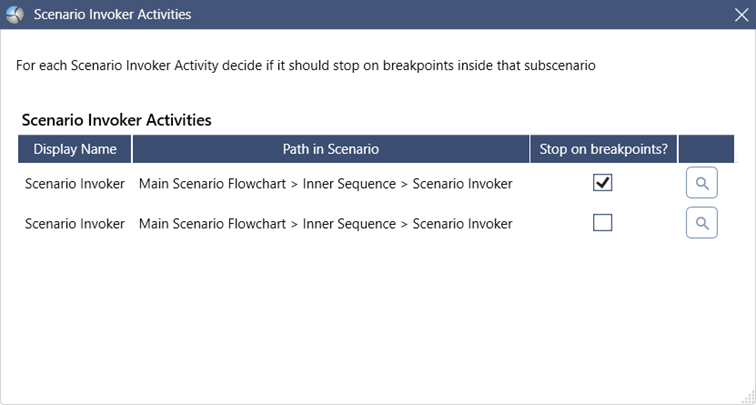
Stop on breakpoints in subscenarios defines Debug mode’s behavior regarding any subscenarios ran by the Scenario Invoker activity.
It’s possible to configure whether Debug should also stop on any breakpoints set in the subscenarios individually for each subscenario.
Note: By default the option is not checked and Debug mode will ignore them.